The utilization trap: when demand exceeds capacity
In my work with organizations, I rarely see leaders explicitly ask whether people are working 100% of the time. The assumption is usually already built into the operating model: there is always more demand, and the people responsible for delivering it are expected to absorb that demand.
That is where the utilization trap begins.
The problem is not utilization itself. It is sustained utilization without enough capacity to absorb normal variation, learning, maintenance, and unexpected demand.
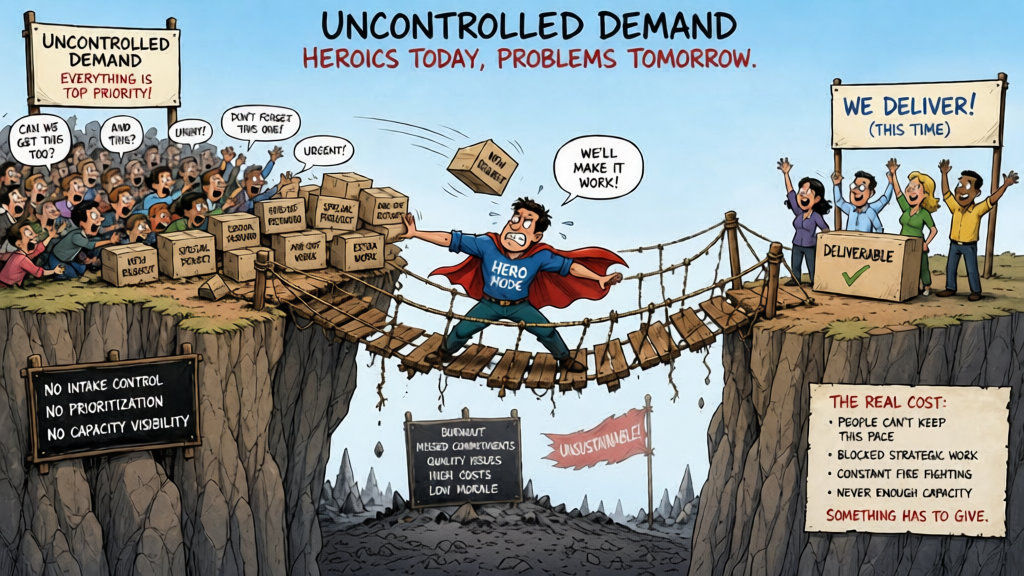
When incoming work has no meaningful relationship to available capacity, the system shifts from planned utilization to over-utilization. Teams take on more than they can sustainably deliver. Priorities collide. Work waits. People often compensate with longer hours, constant context switching, and heroic effort.
Heroics can hide a capacity problem for a while. They cannot solve one. Eventually, quality risk increases, recovery takes longer, and the people carrying the system face greater burnout risk (Bakker & Demerouti, 2007).
The real question is not whether people are busy. It is whether the organization is managing demand so that valuable outcomes can move through the system at a sustainable pace.
Output is not outcome
Output is necessary, but it is not the same as outcome. A team can produce more tickets, documents, code, meetings, analysis, or project hours without creating more customer or business value. An outcome is the change that activity makes possible: a faster decision, a safer operation, a retained customer, lower risk, or a capability people actually use.
This distinction is becoming more visible as AI makes it easier to generate work products faster than organizations can review, integrate, approve, or adopt them. AI may help someone draft more content, analyze more data, or produce more code. If review, testing, approval, integration, or adoption remains constrained, the system gets busier without necessarily getting more valuable. It can also make the demand problem worse by making it easier to create work than to finish it.
The better leadership question is simple:
Is our capacity increasing the throughput of valuable outcomes, or are we using heroics to hide an unmanaged demand problem?
Why sustained demand above effective capacity is fragile
A system operating at or near effective capacity has little room for variation. A new request arrives. An estimate is wrong. A dependency fails. Someone is unavailable. If demand continues to arrive without a corresponding decision about priorities or capacity, the work has nowhere to go except into a queue, onto a person, or into overtime.
Queueing theory gives us a useful warning. Little’s Law connects work in progress, throughput, and cycle time: when throughput stays stable, more work in progress means more time in the system. As utilization rises, waiting and congestion tend to rise with it under the conditions described by queueing models (Little, 1961; Hopp & Spearman, 2011). When demand exceeds effective capacity, starting more work does not automatically create more throughput. It tends to create longer queues, more switching, and more pressure.
There is another risk: no graceful recovery. In an overloaded system, failure is not absorbed; it spreads. An incident displaces planned work. A defect creates rework. One person’s absence becomes a bottleneck. The organization relies on escalation and heroics because it has designed away its recovery capacity.
That is fragility dressed up as commitment.
Slack is not waste
Lean thinking asks us to remove waste. It does not ask us to eliminate every moment that is not attached directly to a deliverable. Improvement, learning, pairing, automation, quality practices, discovery, and recovery are capabilities the system needs.
A team with no time to improve eventually spends more time compensating for yesterday’s problems. A team with no time to pair may maximize individual occupancy while losing knowledge transfer, shared ownership, and built-in quality. A team with no time to learn repeats the same failure modes, only faster.
The goal is not idle capacity. It is intentional capacity: enough room to deliver, learn, improve, and absorb variation without turning every surprise into a crisis. That requires a management decision that many organizations avoid: when demand exceeds capacity, something must change. The organization must reduce demand, change the priority, add capacity, or accept a different delivery date. Asking the existing system to absorb the difference is not a capacity plan.
What extreme utilization targets teach people
Metrics used as targets change behavior. When utilization is treated as a performance measure, people can respond in ways that make the broader system worse:
- Keep work open or split it artificially to appear occupied.
- Avoid helping another team because collaboration may not count toward utilization.
- Defer refactoring, automation, documentation, and training.
- Reduce pairing or peer review because two people on one problem can look inefficient.
- Accept low-value work instead of preserving capacity for higher-value work.
- Hide risks and delays until they become more expensive.
- Protect local utilization even when the real constraint is downstream.
- Treat overtime and heroics as evidence of commitment rather than evidence of excess demand.
These are not character flaws. They are predictable responses to the incentive design. Reward occupancy and visible effort, and the system will learn to maximize both, even when neither improves outcomes.
What to measure instead
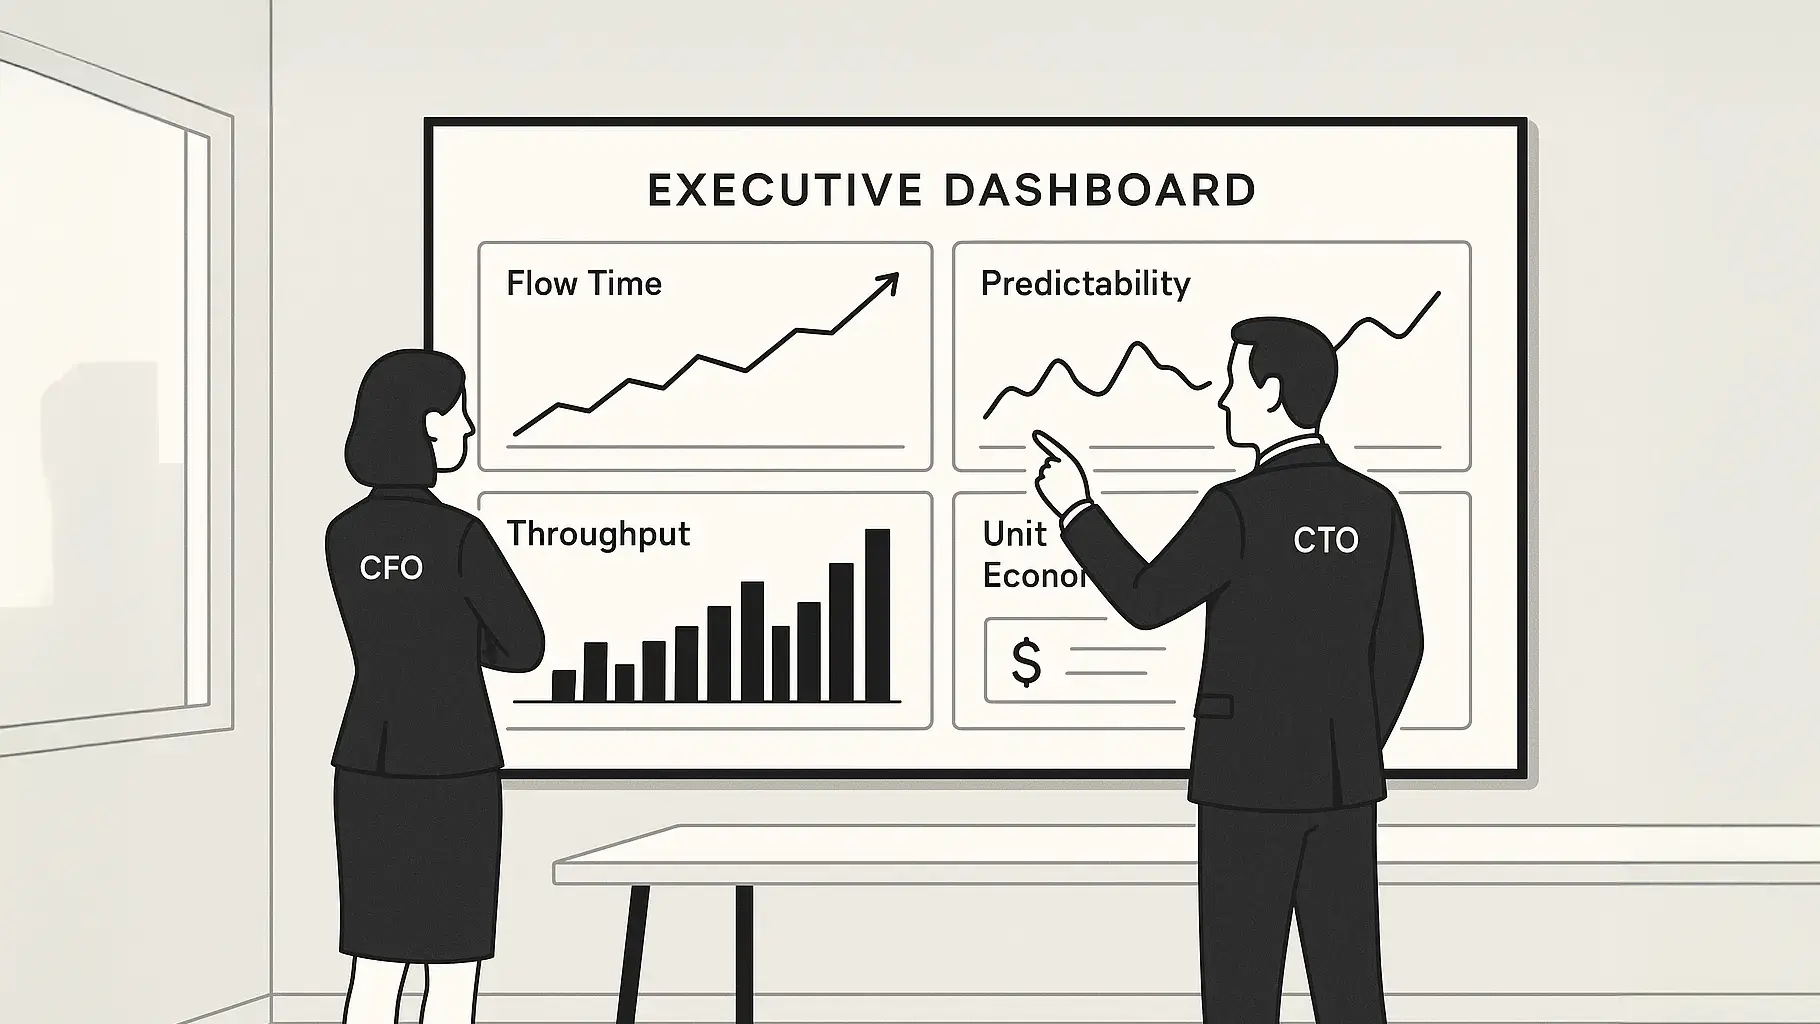
Replacing utilization with one new KPI will not fix a systemic problem. Leaders need a set of measures that connects demand and capacity to flow, outcomes, quality, and sustainability.
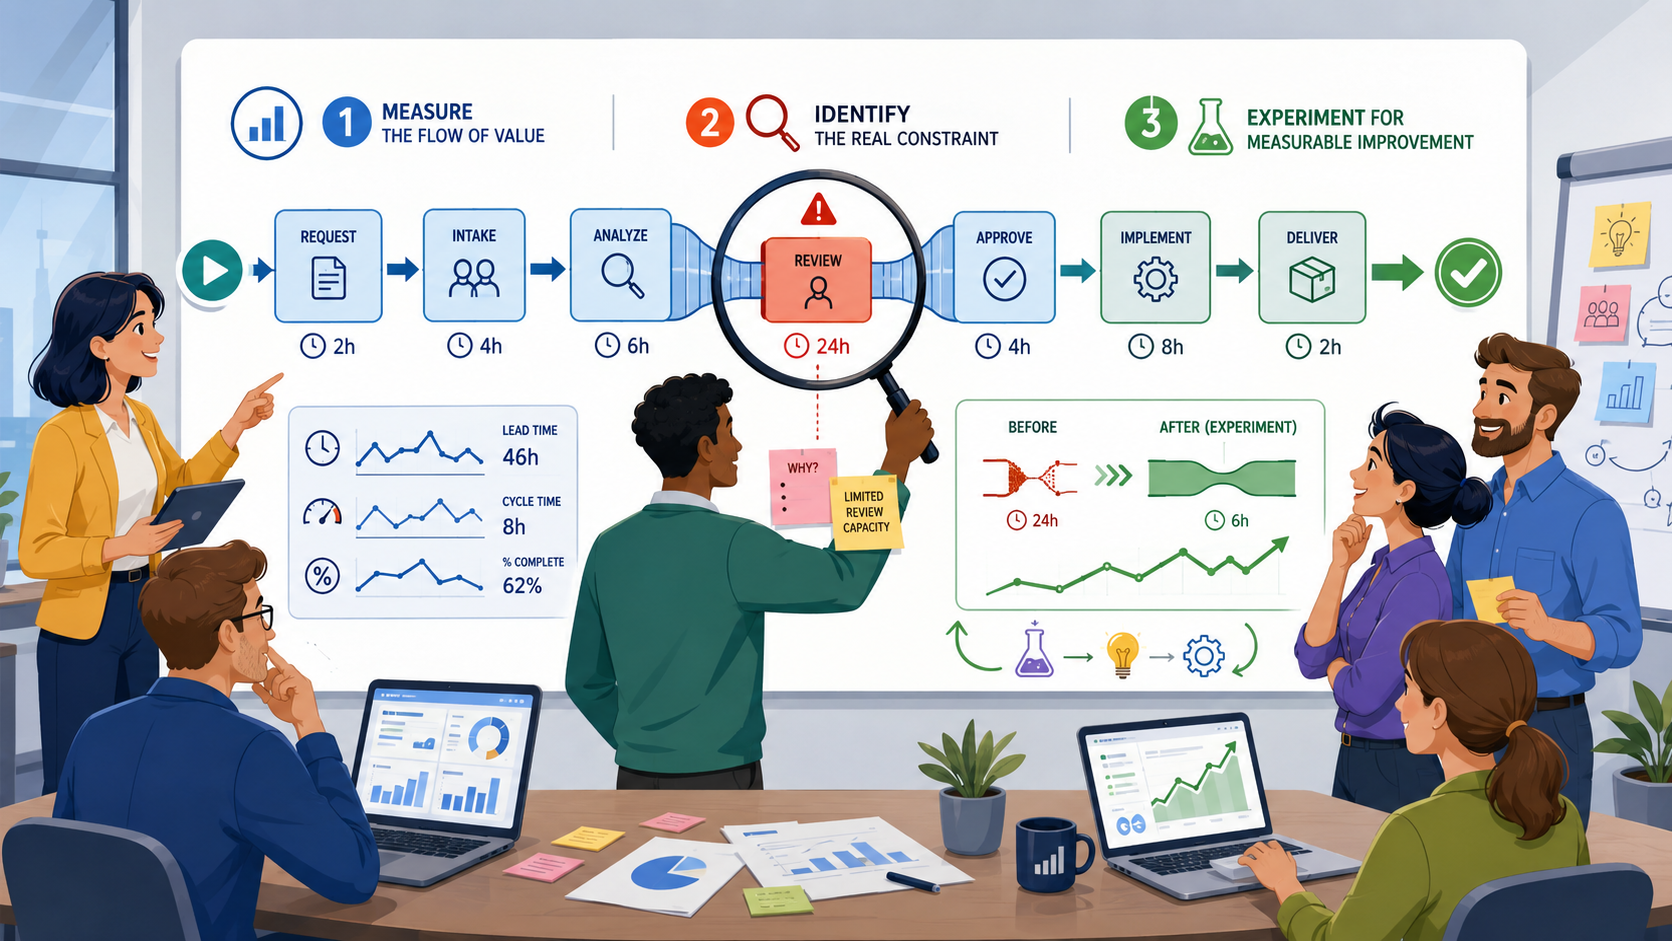
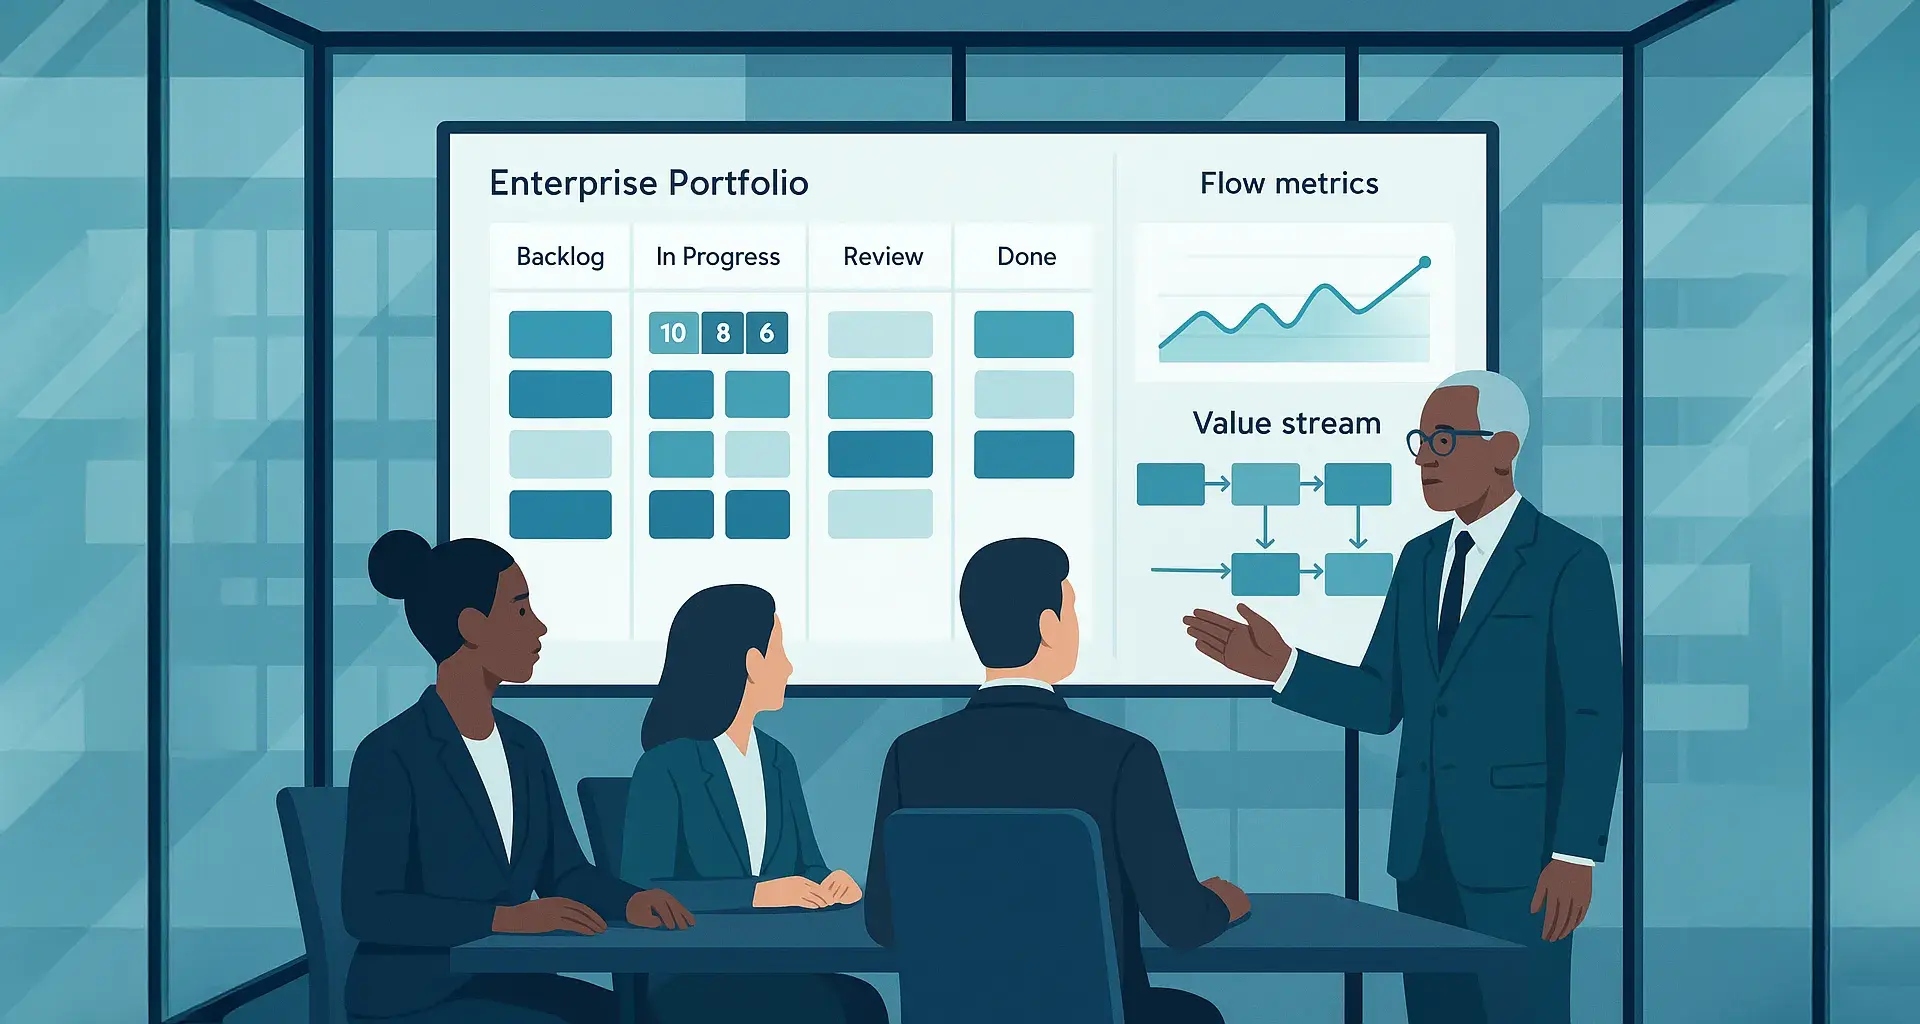
For flow, look at work-item age, cycle-time distribution, throughput, work in progress, queue length, waiting time, and delivery predictability. Compare incoming demand with completed work. If the gap persists, make it visible instead of expecting teams to close it through overtime.
For outcomes, look at customer or user behavior, adoption, revenue protected, cost avoided, risk reduced, time saved, and benefits realized after delivery. Connecting objectives and key results to delivered work is more useful than counting completed activity alone.
For quality and resilience, look at escaped defects, rework, change failure rate, time to restore service, defect trends by workflow stage, and recovery time after disruptions. It can also help to track how much capacity goes toward prevention and improvement. DORA research provides one established example of connecting delivery performance with reliability and organizational conditions (Forsgren et al., 2018; Google Cloud DORA, 2024).
For sustainability, examine team health, burnout signals, avoidable attrition, time spent on pairing and learning, automation investment, and concentration of critical knowledge. Ask whether teams can say no to low-value work and whether planned work regularly requires overtime to finish. Use these measures at an aggregate system or team level for learning and improvement—not to rank individuals or teams. Teams also need enough psychological safety to surface risks, ask for help, and learn from failure (Edmondson, 1999).
These measures do not make finance or resource management less rigorous. They make the conversation more economically meaningful. Capacity decisions can be evaluated by the movement of value and the cost of demand, not just by the percentage of time assigned to activity.
A practical reset
Start with one value stream or product area. Bring leaders, finance partners, and delivery teams into the same conversation and ask:
- What valuable outcome are we trying to move?
- How much demand is entering the system, and how much is leaving it?
- Where is work waiting, being reworked, or blocked?
- What capacity must we protect for quality, learning, improvement, and recovery?
- When demand exceeds capacity, who decides what will stop, wait, or change?
Then compare those answers with the current utilization expectations. If the operating model assumes every hour is available for delivery and treats overtime as the solution to excess demand, it is working against flow.
This is not a choice between accountability and permissiveness. It is a choice between managing demand honestly and hiding a capacity gap behind individual sacrifice.
The question worth asking
The next time someone points to a team that is delivering through long hours and heroic effort, ask one more question:
What demand decision would make this work sustainable without relying on heroics?
That question moves the conversation from busywork to value throughput, from local optimization to system performance, and from fragile efficiency to resilient delivery.
Sources
- Little, J. D. C. (1961). “A Proof for the Queuing Formula: L = λW.” Operations Research, 9(3), 383–387. https://doi.org/10.1287/opre.9.3.383
- Hopp, W. J., & Spearman, M. L. (2011). Factory Physics (3rd ed.). Waveland Press.
- Forsgren, N., Humble, J., & Kim, G. (2018). Accelerate: The Science of Lean Software and DevOps: Building and Scaling High Performing Technology Organizations. IT Revolution.
- Google Cloud DORA. (2024). Accelerate State of DevOps Report. https://cloud.google.com/devops/state-of-devops
- Bakker, A. B., & Demerouti, E. (2007). “The Job Demands–Resources model: State of the art.” Journal of Managerial Psychology, 22(3), 309–328. https://doi.org/10.1108/02683940710733115
- Edmondson, A. C. (1999). “Psychological Safety and Learning Behavior in Work Teams.” Administrative Science Quarterly, 44(2), 350–383. https://doi.org/10.2307/2666999
← All insights